02 Errors, Accuracy and Precision

Learning Outcomes
- Differentiate between accuracy and precision; and
- Estimate errors from multiple measurements of a physical quantity using variance.
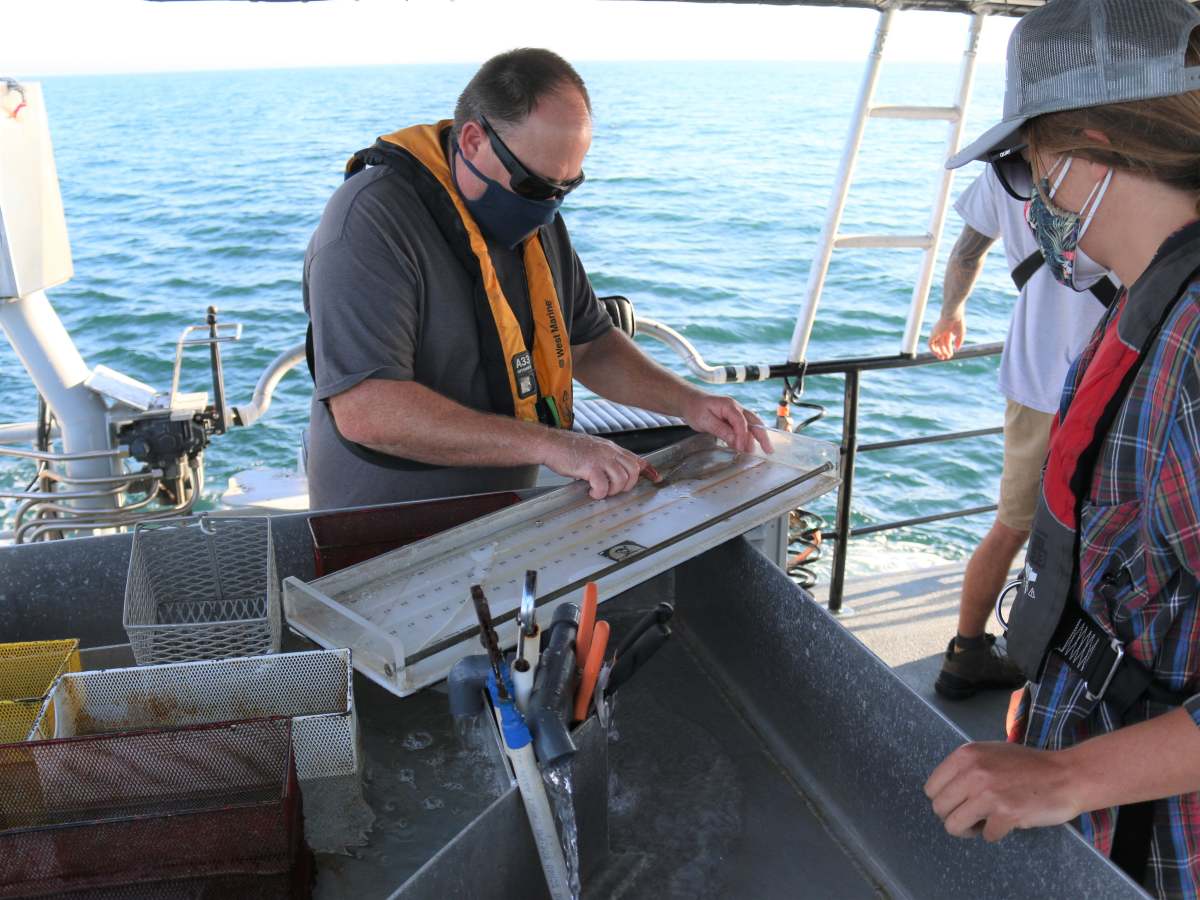 |
| A marine biologist measures a fish collected during trawl community sampling. |
Accuracy, Precision, and Significant Figures
In marine biology, accurate and precise measurements are crucial for reliable experiments. Accuracy means how close a measurement is to the true value. For example, if the true length of a fish is 20 cm and your measurements are 19.8 cm, 20.1 cm, and 20.0 cm, these are accurate because they are close to 20 cm.
Precision means how close repeated measurements are to each other. Using the fish example, if you measure its length three times and get 19.8 cm, 19.9 cm, and 20.0 cm, the measurements are precise because they are very similar.
It's important to have both accuracy and precision. For instance, if you measure the same fish and get 19 cm, 21 cm, and 20 cm, the measurements are not precise because they vary too much.
Significant figures are the digits in a measurement that contribute to its precision. They include all the certain digits plus one uncertain digit. For example, if you measure a fish and get 20.1 cm, this measurement has three significant figures (2, 0, and 1). If another measurement is 20.10 cm, it has four significant figures, showing more precision. When you report measurements, using the correct number of significant figures is important to accurately reflect the precision of your measuring tool.
Instruments need to be calibrated correctly to ensure accuracy and precision. For example, a scale used to weigh marine samples must show the same weight for a known object each time it is weighed.
Consider a GPS system used to locate a coral reef. If the GPS gives locations close to the reef but not exactly the same every time, it is accurate but not precise. If the GPS gives the same location every time but it's far from the reef, it is precise but not accurate. The best system would be both accurate and precise, showing the same, correct location each time.
Study the example below.
Marine Biological Sets of Values | Accuracy | Precision |
|---|---|---|
Coral Polyp Diameter (0.5 cm, 0.51 cm, 0.49 cm, 0.5 cm); True Value: 0.5 cm | high | high |
Dissolved Oxygen (6.8 mg/L, 6.7 mg/L, 6.6 mg/L, 7.0 mg/L); True Value: 6.75 mg/L | high | low |
Plankton Density (12 cells/mL, 20 cells/mL, 15 cells/mL, 18 cells/mL, 17 cells/mL); True Value: 16 cells/mL | low | low |
Complete the following sentences to explain the answers in the table above:
- The accuracy is ___ because ___. Precision is ___ because ___.
- The accuracy is ___ because___. Precision is ___ because ___.
- The accuracy is ___ because ___. Precision is ___ because ___.
Answer Key
- The accuracy is high because the measurements are close to the true value. Precision is high because the measurements are close to each other.
- The accuracy is high because the measurements are close to the true value. Precision is low because the measurements are far from each other.
- The accuracy is low because the measurements are far from the true value. Precision is low because the measurements are far from each other.
Problem Set
II. Copy and complete the table below.
Marine Biological Sets of Values | Accuracy | Precision |
|---|---|---|
Water Temperature (14.1°C, 15.0°C, 14.3°C, 15.2°C); True Value: 14.5°C | ||
Salinity Level (30.2 PSU, 35.0 PSU, 32.8 PSU, 29.4 PSU, 34.1 PSU); True Value: 32.0 PSU | ||
Fish Length (10.1 cm, 10.2 cm, 10.1 cm, 10.0 cm); True Value: 10.1 cm |
III. Complete the following sentences to explain the answers in the table above:
- The accuracy is ___ because ___. Precision is ___ because ___.
- The accuracy is ___ because___. Precision is ___ because ___.
- The accuracy is ___ because ___. Precision is ___ because ___.
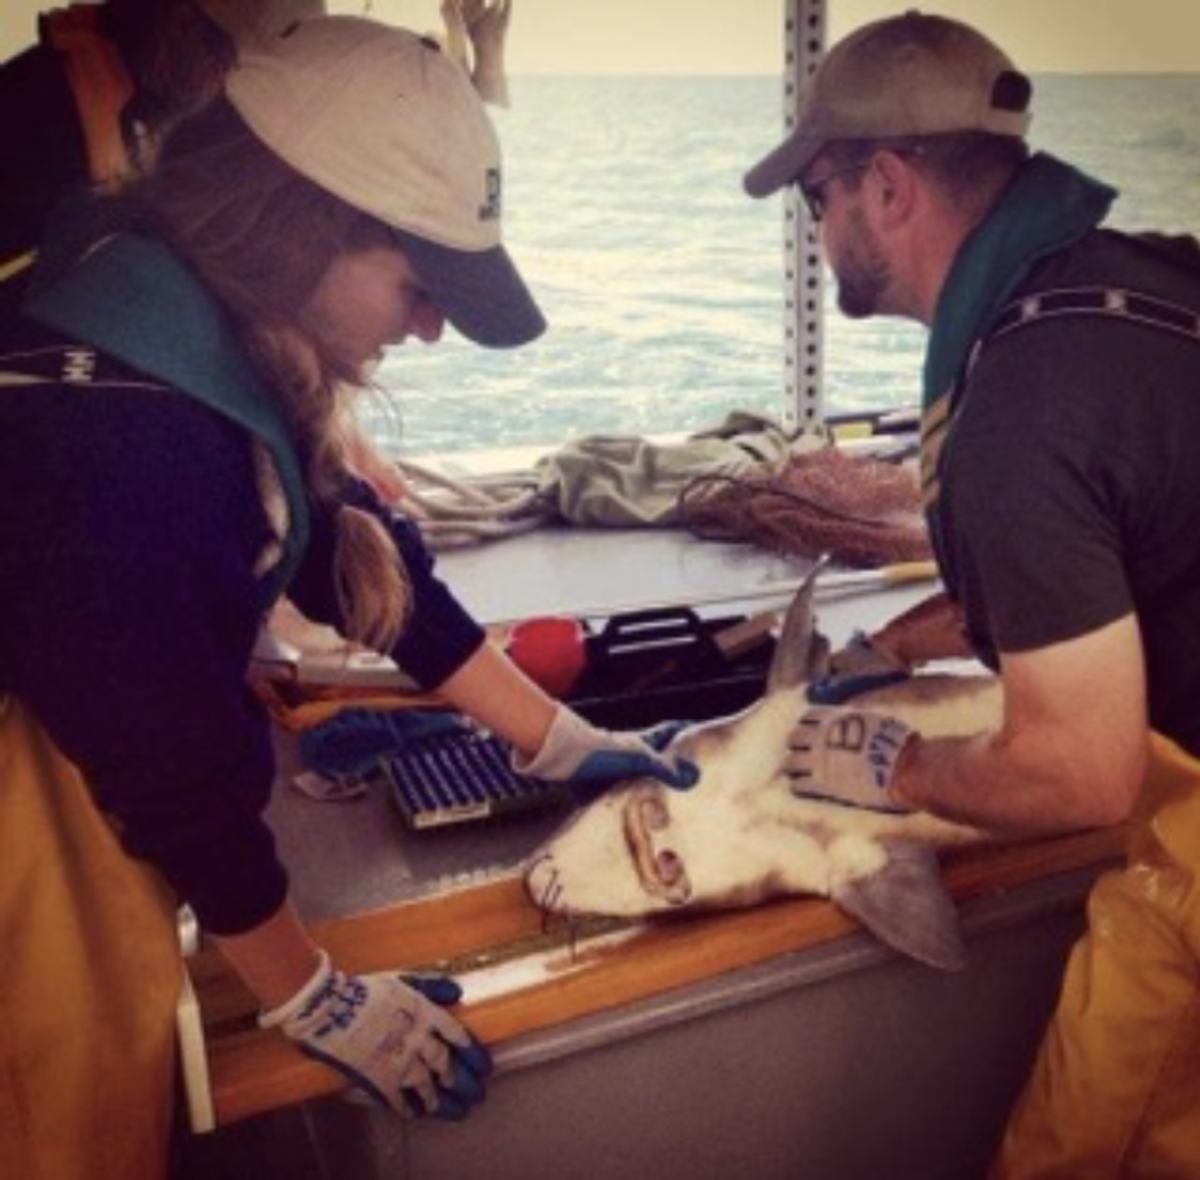 |
| Marine biologist Ellen Spooner conducting research on a sturgeon |
Measurement Errors
Measurement error refers to the difference between a measured value and the true value. There are two main types of errors: random errors and systematic errors.
- Random errors occur due to unpredictable factors such as changes in the environment or human mistakes. These errors cause measurements to vary inconsistently.
- Systematic errors are predictable and occur because of flaws in the equipment or methods used. These errors cause measurements to deviate in a consistent way from the true value.
Estimating Errors Using Variance
Variance helps us understand how spread out our measurements are around the average (mean) value. It tells us about the precision and reliability of our measurements. To calculate variance:
1. Find the mean (average) of your data set.
2. Subtract the mean from each data point and square the result.
3. Add up all the squared differences.
4. Calculate the variance by dividing this sum by the number of data points.
A smaller variance means your measurements are more precise and have less error. A larger variance suggests there is more variability and potential errors in your measurements.
For example, if you measure the length of fish multiple times, a smaller variance would mean that your measurements are consistently close to each other and to the true length of the fish. A larger variance would mean that your measurements vary widely, indicating potential errors.
Understanding and minimizing these errors is crucial for accurate and reliable data in marine biology studies.
Problem Set
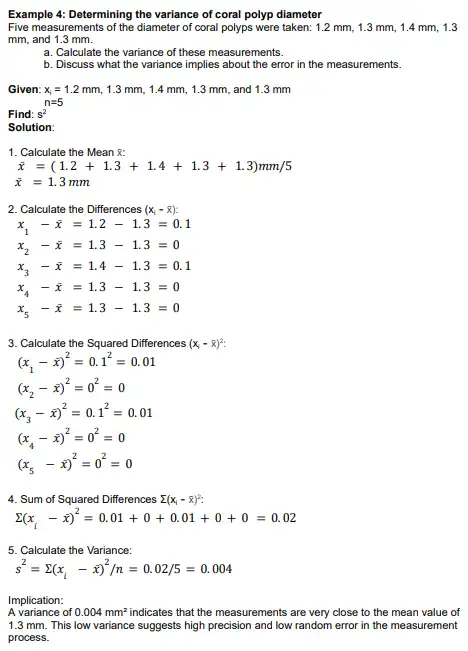
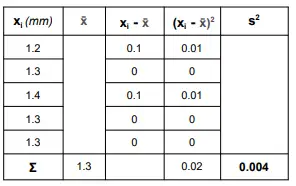
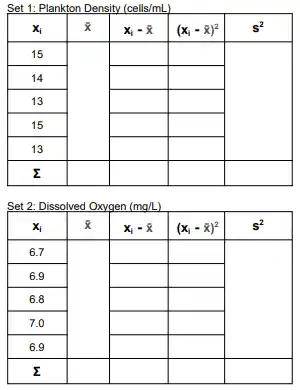
IV. Determine the variance of the following sets of data by completing the table and discuss what the variance implies about the error in the measurement.
References
- Urone, P. P., & Hinrichs, R. (2020). The language of physics: Physical quantities and units. In Physics. OpenStax. https://openstax.org/books/physics/pages/1-3-the-language-of-physics-physical-quantities-and-units
.png)
.png)
.png)
Comments
Post a Comment